Predicting House Prices Using Linear regression
Main Problem and Objectives
- Build a prediction model for house pricing in Ames, IA
- Where are most sales taking place?
- Where are the most expensive houses located?
- Discuss Possible Improvements
Describing the Data and Limitations
- Target Prediction Feature: Sale Price
- Number of Instances: 1460
- Number of Attributes Allowed: 18
- Years of data collected: 2006 - 2010
- Missing
Limitations
- The attributes provided are not necessarily the best indicators of the house pricing
- The data collected is mostly around a particular unstable time in the market
Understanding the Data
Looking at Correlations 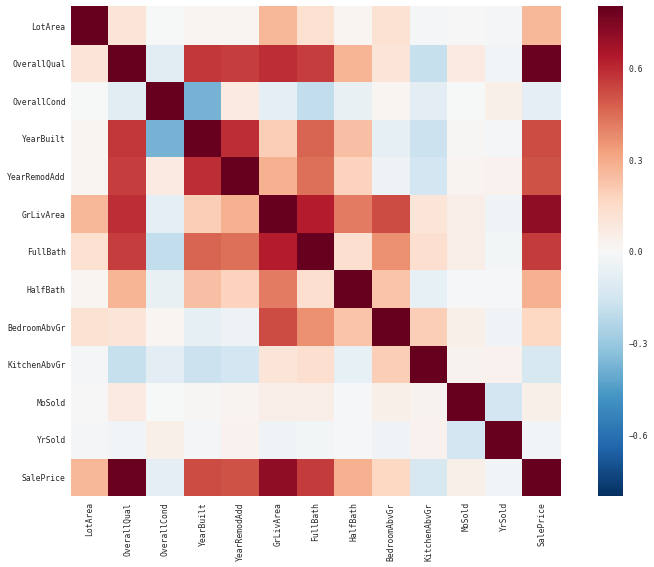 Quality & Price Correlation
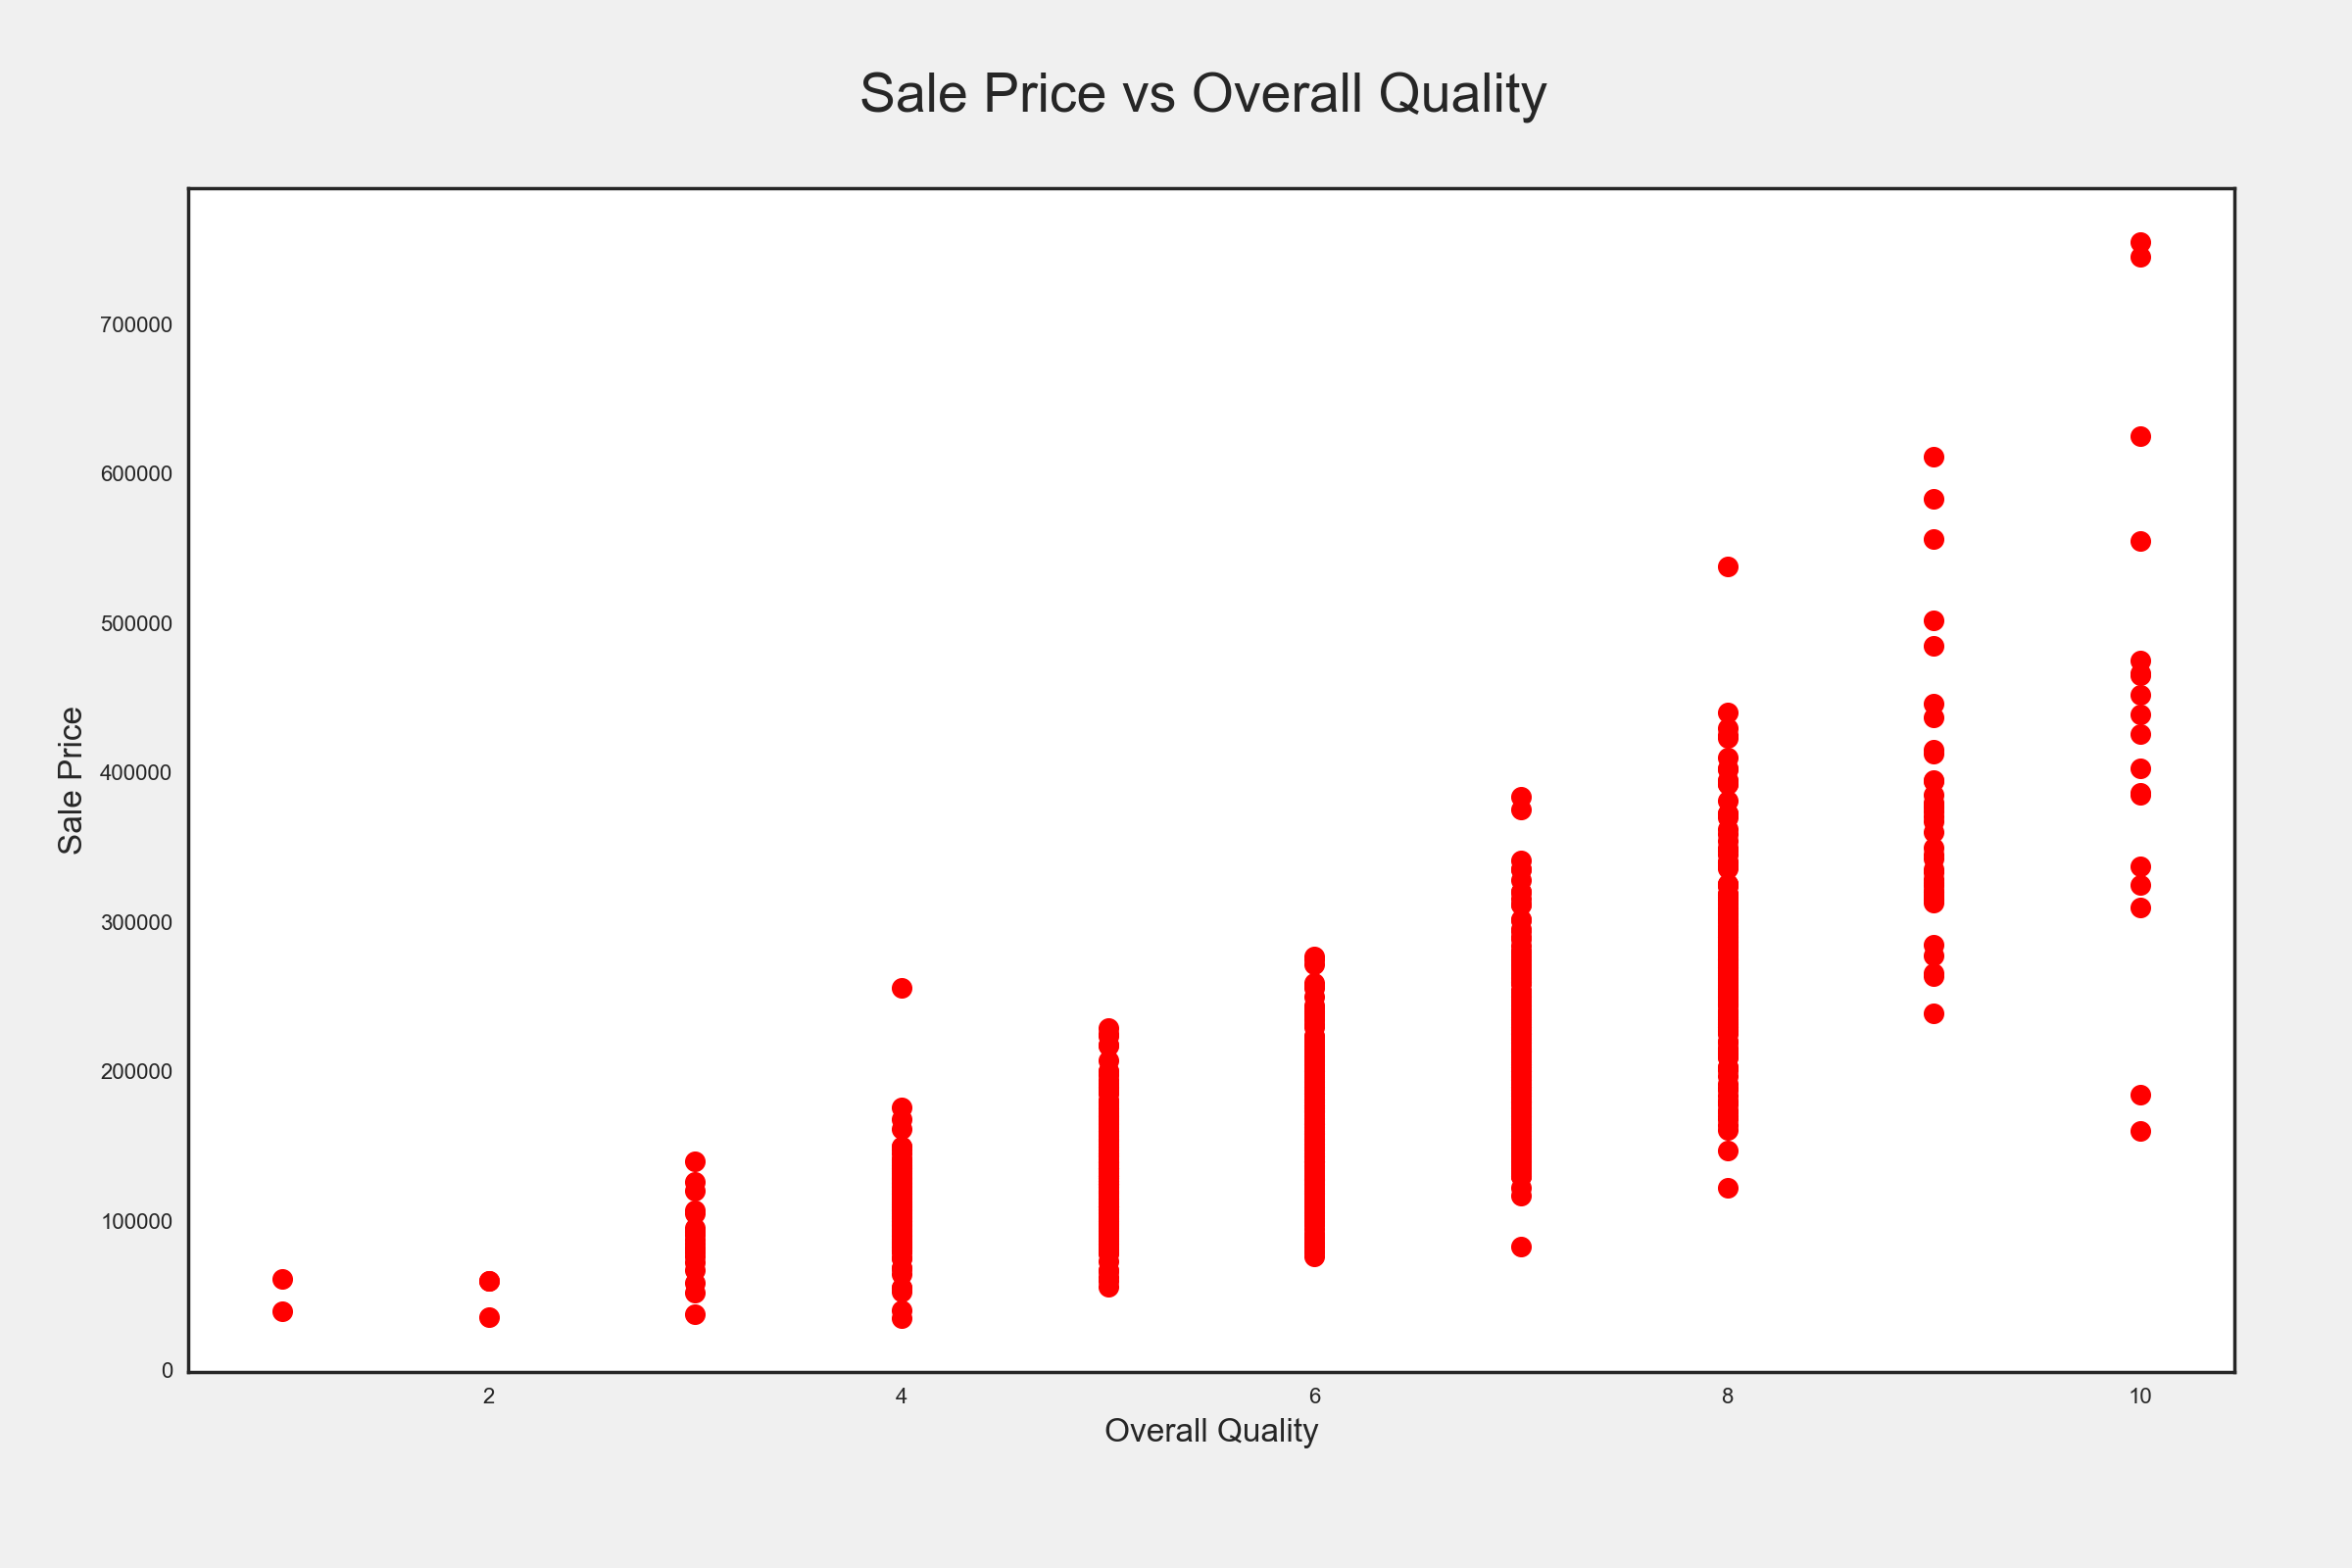
Looking at Sale Prices Across Neighborhoods 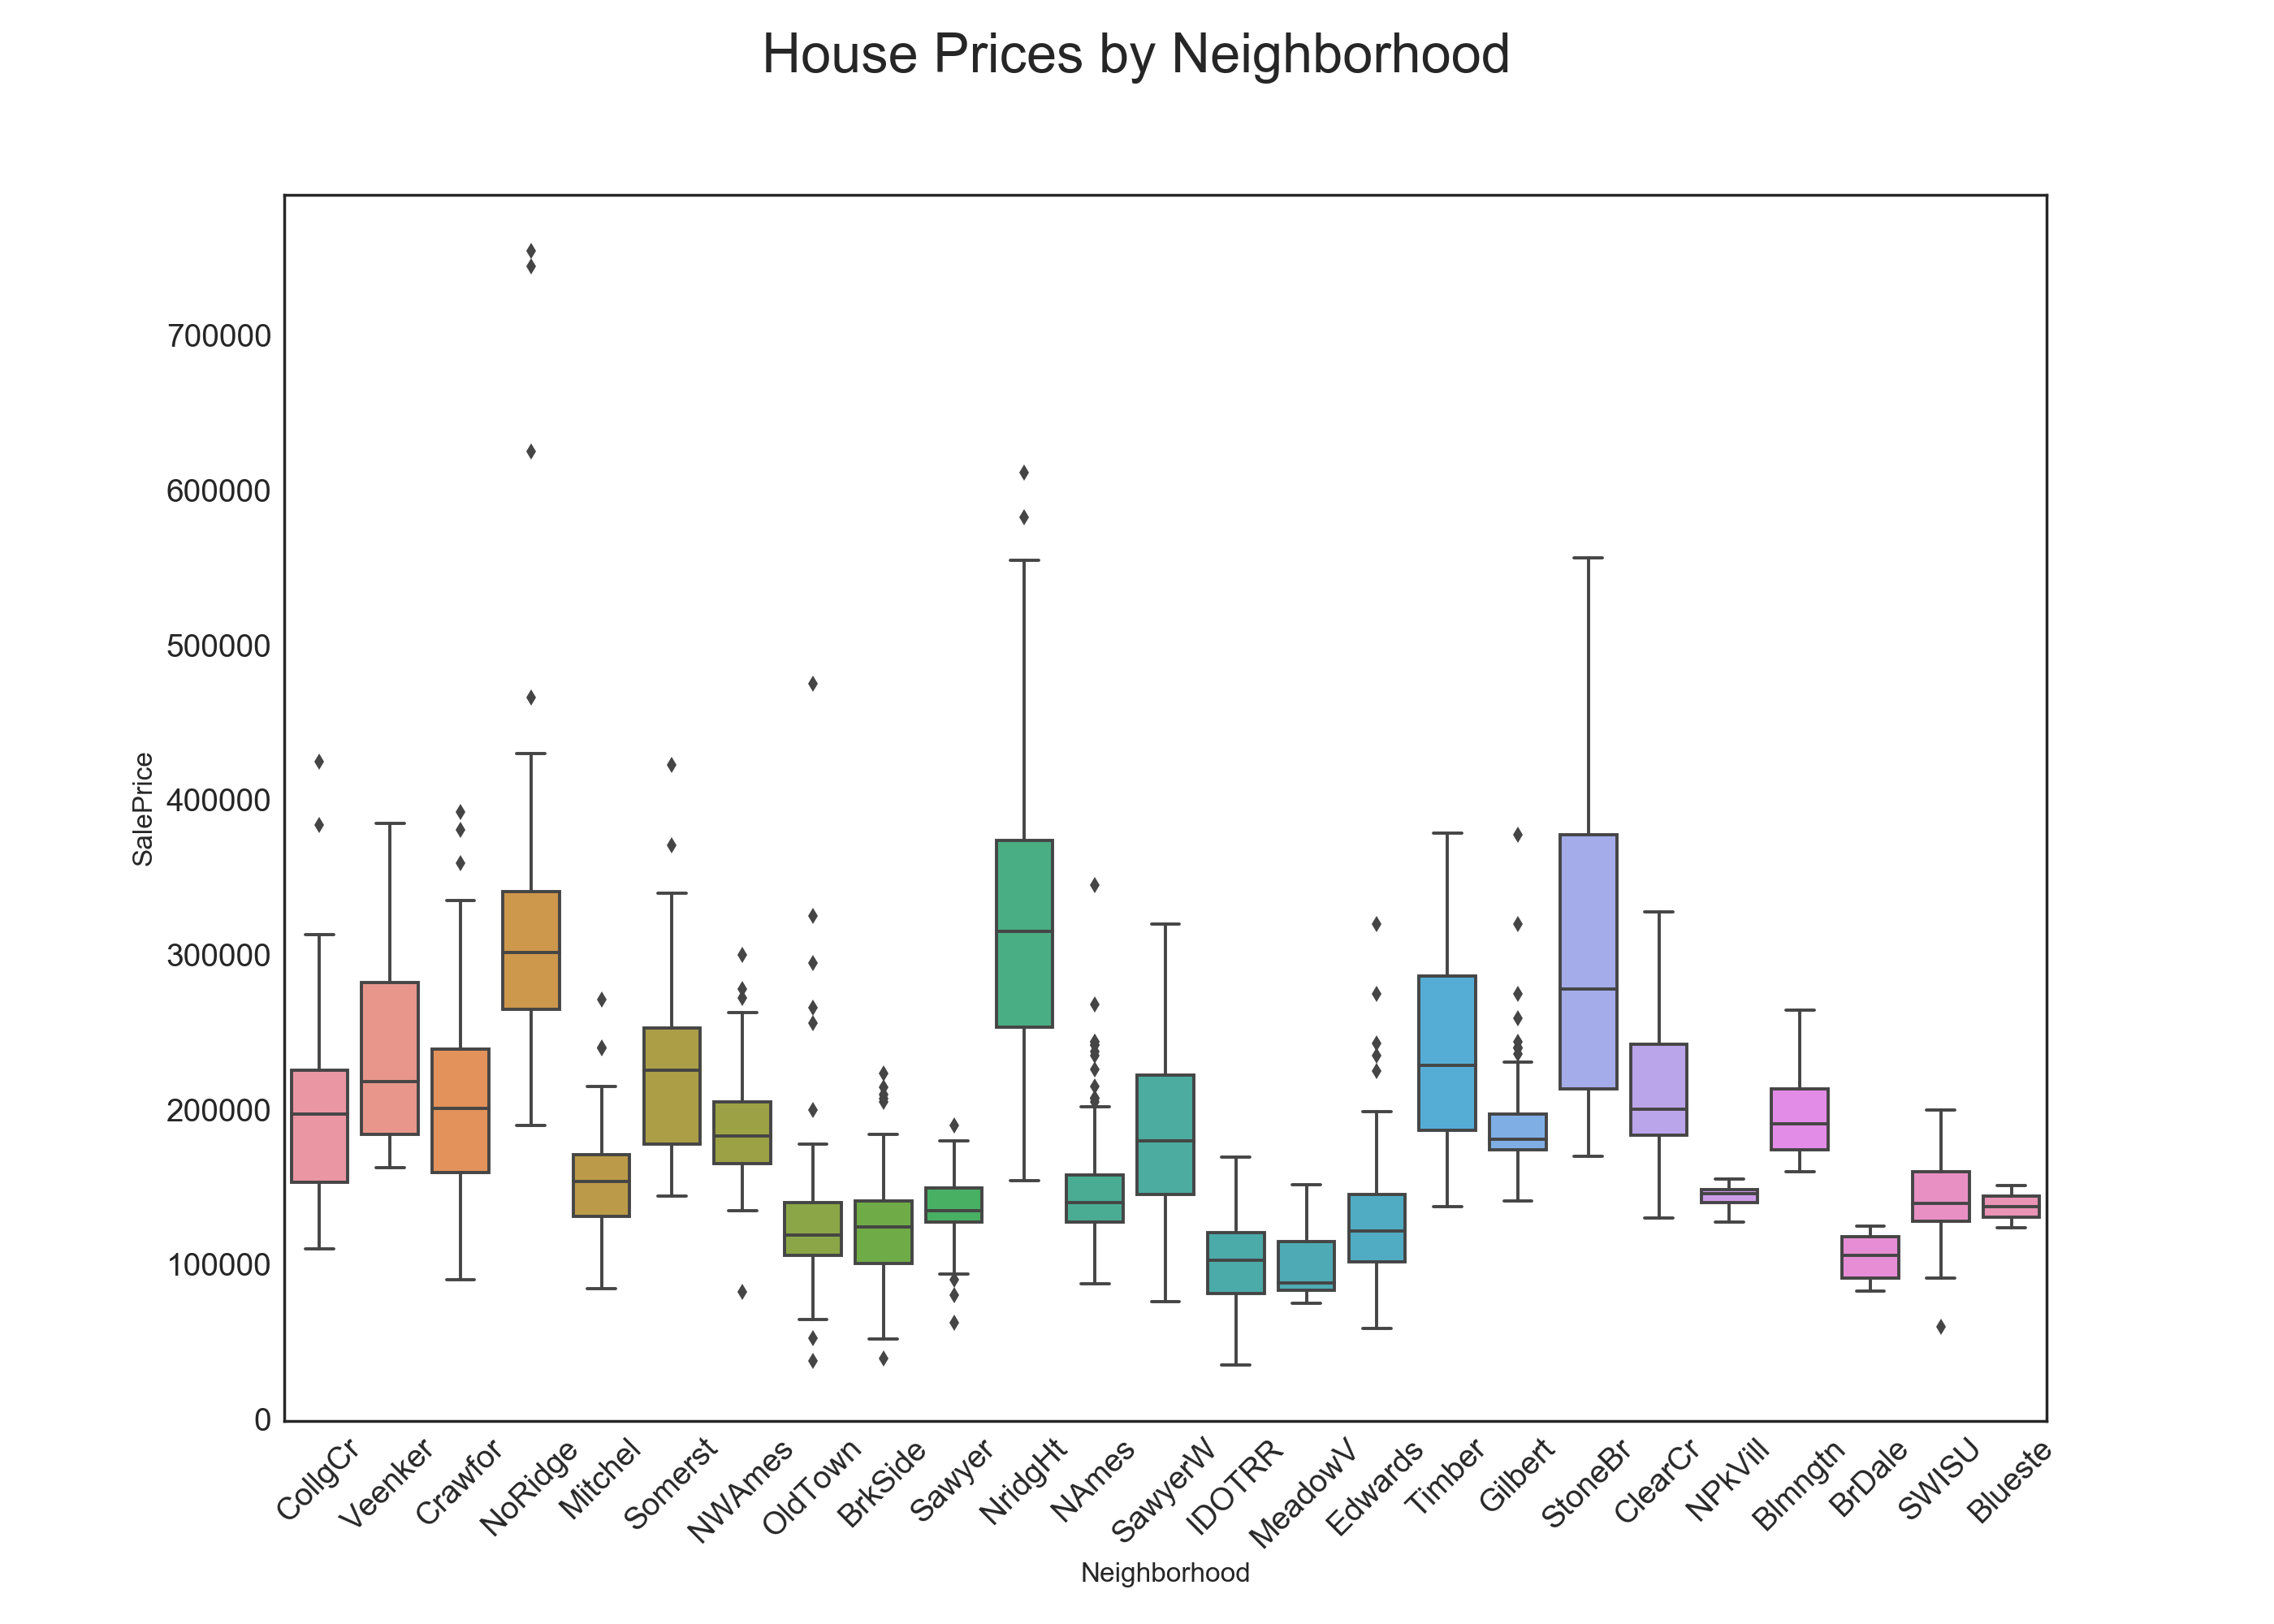
Where are the most sales happening?
- Most Sales Happening in :
- North Ames
- How many happened?
- 225 (About 15.41 % of total sales)
Where are the most expensive homes?
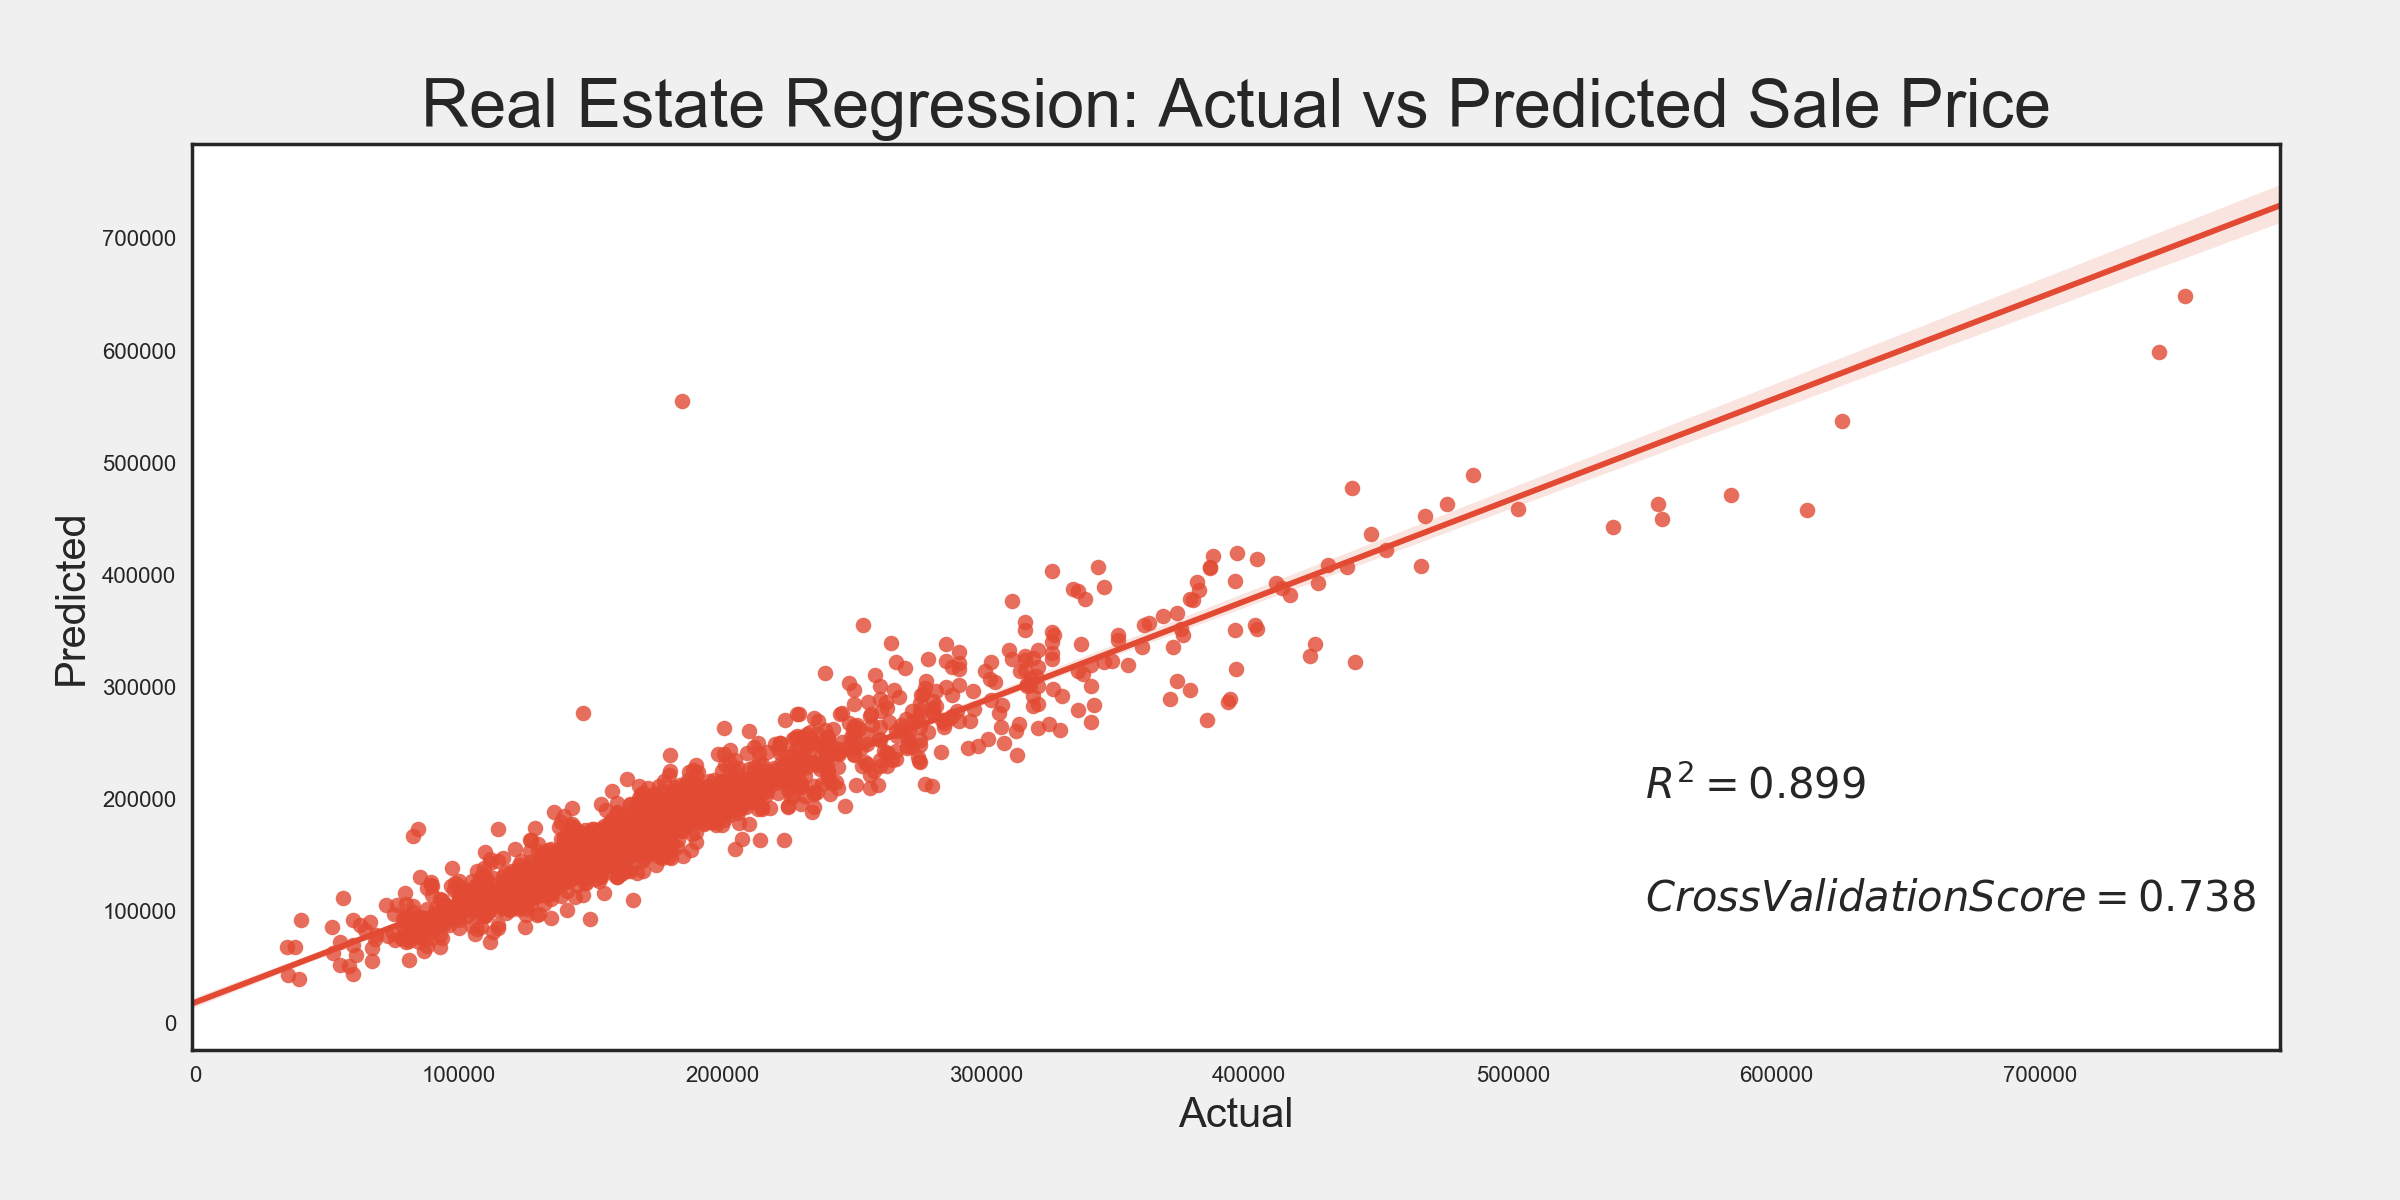
Creating a Regression model
- Type of Regression: Linear
- Attributes Dropped: Utilities
- Dummy Variable Selection: All except Lot Area and GrLivArea
- Accuracy Testing:
- R Squared = 0.899
- Mean Absolute Error: 16261.24
- Mean Squared Error: 637850318.41
- Root Mean Squared Error: 25255.70
- Cross Validation Score: 0.738
- Limitations of the Model
There were a lot of outliers in the data that have caused the RMSE and MSE to be quite high The cross validation score was lower than the initial model made, although R Square was improved this could be a sign of some over fitting on this model.
Possible Improvements
-
More location based metrics such as surrounding business’, schools, police stations, etc
-
More insight into the overall condition and quality metric
-
More data points for expensive homes, to improve predictions on the expensive homes.