The Problem
The objective of this project is to create a regression model using binary indicators to help predict if a salary is either high or low. There are only basic binary indicators given initially, and many of them need to be constructed from the acquired data. To acquire data, a scrape was done of Glassdoor and then cleaned and input into a Padas Dataframes for analysis.
Risks:
-
the dataset is mostly concentrated around a small number of cities which I found to have a large number of data science positons, there are many outside of these states that were not taken into account due to the time constraints of the project.
-
there is missing data for certain locations since the initial scrape would not let me go past ~30 pages per location. This means each “state” isn’t actually the entire state but instead its the first 30 or so pages for that particular state.
-
the salary estimate themselves are limited since I am basing my predictions using the already predicted salaries from Glassdoor and their own algorithm. Since they can’t provide exact salaries, I got the mean(median) between the two min and max salary range and used that as my salary indicator.
-
the feature selection is done arbitrarily by most common words that sound impactful, however this may not be the best approach.
Assumptions:
-
Given the enormous dataset and time constraints, a lot of job positions not related to data science may have slipped in. Although I tried filtering this out on the initial scrape, it was difficult to do so completely, it will be assumed that all scraped data is data science related
-
Some data may have overlaps if the same company is hiring in multiple states, I did try to mitigate this but there may be overlap overall
Webscraping
In order to web scrape Glassdoor, selenium and beautiful soup were both used. Selenium was needed since the website was an AJAX website and would return an error with a normal request. Beautiful soup was used to parse through the page and find the correct panels needed for scraping.
The first step in scraping was getting the needed search results, meaning data science salaries for a specific state. Once we had the needed search results then the initial extraction was done meaning these features were extracted:
- Company name
- Location name
- Salary
- Post URL
- Position
In order to do this through all the states I wanted, it was easier to break each step into functions. 7 States were scraped separately due to Glassdoor not showing results beyond ~30 pages. These results were all extracted from their csv output and then combined to make one data frame with the all the page URL’s and relevant information. This is where the time consuming scrape started, since about 4K pages had to be opened and scraped for information. The process would take about 30 minutes per 500 pages.
Below, is the function used to do the initial scrape.
def scrape_panel(soup):
    leftcol = soup.find('ul', class_="jlGrid hover")
    comp_name = []
    loc_name  = []
    salary    = []
    job_urls  = []
    position  = []

    #------------------------------------------------------------#
    for n in leftcol.find_all("div",class_="flexbox empLoc"):
        try:
            comp_name.append(n.text.encode('ascii','ignore').split("  ")[1])
        except:
            comp_name.append(None)
        try:
            loc_name.append(n.text.encode('ascii','ignore').split("  ")[2])
        except:
            loc_name.append(None)

    #------------------------------------------------------------#
    for s in leftcol.find_all('li', class_='jl'):
        try:
            salary.append(s.find('span', class_='green small').text.encode('ascii','ignore'))
        except:
            salary.append(None)
    #------------------------------------------------------------#
    for l in leftcol.find_all("a"):
        try:
            job_urls.append('https://www.glassdoor.com'+l['href'].encode('ascii','ignore'))
        except:
            job_urls.append(None)
        try:
            position.append(l.text.encode('ascii','ignore'))
        except:
            position.append(None)

    job_urls = job_urls[0::2]
    position = position[1::2]
    #------------------------------------------------------------#
    data = pd.DataFrame({'company_name': comp_name,\
                         'location': loc_name,\
                         'salary':salary,\
                         'position':position,\
                         'urls': job_urls})
    #------------------------------------------------------------#
    return data
Data Cleaning
Once the scraping portion was completed, the data had to be cleaned. Here are some of the main things I was looking for when cleaning:
- Repeated job postings
- Empty cells/ Null values
- Must have salary information provided
Upon finishing the initial cleaning, here are the salary distributions that were found:
From the histogram, the salary distribution is quite normal for a salary distribution with the main concentration of data around the 100K region.
Median = 100,000 Mean = 102,961.48
It would also be important to note the concentration of our data in terms of states. Meaning, which states are we getting most of our data from after the cleaning?
Although I started with around 1000 postings for each state, many of them were lost during the cleaning. It can be seen above that the majority of the listings will be from California and New York.
Modeling and Feature Extraction
The target salary was chosen as the median for my model creation since this was the cutoff portion for most of the top or lower salaries.
Features were extracted by getting a value count for all the words going through the title and the job description. Then I looked at the top 20 and hand picked the ones that were most relevant. These words were looked for in the description and were give a True of False marker if found or not. Once these values were all made into dummy variables then the data had to be split into the target and data as X and y. The target column was acquired by running the salaries through the target salary (median).
from sklearn.model_selection import train_test_split
from sklearn.model_selection import GridSearchCV
from sklearn.linear_model import LogisticRegression

X = reg_classf
y = data['target']

X_train, X_test, y_train, y_test = train_test_split(X, y, test_size=0.30, random_state=42)

logreg = LogisticRegression(solver='liblinear')

C_vals = [ .1,.2,.3,.7,1,3,6,10,20,30,40]
penalties = ['l1','l2']

gs = GridSearchCV(logreg, {'penalty': penalties, 'C': C_vals},\
                  verbose=False, cv=5)
gs.fit(X_train, y_train)
This data was able to provide an accuracy of: 65%
Below is a confusion Matrix showing the actual (top) vs predicted (left).
| Positive | Negative | |
|---|---|---|
| Positive | 412 | 139 |
| Negative | 247 | 353 |
I have also included the ROC curve which is showing some poor results for this specific model. 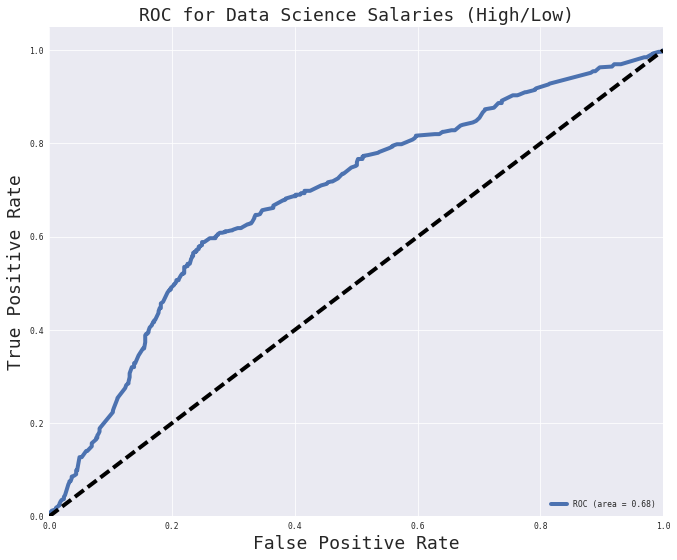
Conclusion and Final thoughts
The model had a best score of about 65%, which is quite poor but should be fine for the first scrape of this project. I feel it could be improved by adding more data, cleaning it better, and improving feature selection.
Finding patterns between the job descriptions and the salary is probably the most crucial in this project and that portion was done poorly due to the pending data cleaning and slow scrape.