The Problem:
There were three portions to this project:
- Collection
- Cleaning
- Analysis and Modeling
The end goal was to be able to accurately predict what a high rated movie might be and the contributing factors towards a high movie rating.
Risks and Assumptions:
This project came down to the dataset and the reliability of the model in the end was highly dependent on how much data was extracted as well as the reliabiltiy of the feature extraction. In terms of reliability, some of the features extracted in this project were not done as meticulously as they could have. Many features were simplified or extracted due to time contraints. Given more time to go over the data cleaning, more analysis could have been done on the null values and missing data such as meta score. Crtic score seems like it could have had a large impact on overall movie rating.
Scraping and Dataset
The first step in the project was to actually get the dataset for movies in the US.
To start, there was a top 250 rating page that was going to be used but I felt that the 250 movies might not be enough for creating a good model.
In order to pull a good number of songs, I found this list of movies released in the U.S from 1972-2016
All U.S. Released Movies: 1972-2016
Since there were around 10,000 movies in this dataset I thought it would not be a good idea to scrape. Last time when I scraped the average scrape time was 2-3 seconds per page as well as running into overall memory issues.
After checking the omdb api, it seemed easier to search movies via their imdb ID as opposed to title since there can be variations in the title.
This lead me to scraping the movie title followed by the IMDB ID and store it in a dataframe:
def scrape_panel(soup):
    col = soup.find('div', class_='list compact')

    names = []
    imdbID = []

    #------------------------------------------------------------#
    for n in col.find_all("td",class_="title"):
        try:
            names.append(n.text.encode('ascii','ignore'))
        except:
            names.append(None)
    #------------------------------------------------------------#
    for i in col.find_all("td",class_="title"):
        try:
            imdbID.append(i.find_all('a')[0])
        except:
            imdbID.append(None)
    #------------------------------------------------------------#
    data = pd.DataFrame({'name': names, 'id': imdbID})
    #------------------------------------------------------------#
    return data
API Calls and Extraction
To get all the movie information, the dataframe created from teh web scrape was used along with this function below:
api_calls = []


for ids in range(len(data)):
    api_calls.append('http://www.omdbapi.com/?i='+data['id'][ids]+'&plot=full')
The API call itself was quite simple since I wanted to extract all the information provided.
Surprisingly this was the easiest part since parsing the JSON output ended up being a bit difficult.
The information was all converted to a dictionary format, converted into a series. The information was stacked and the transformed to genrate a dataframe with all the data.
Data Cleaning
	RangeIndex: 9951 entries, 0 to 9950
	Data columns (total 25 columns):
	Actors          9760 non-null object
	Awards          7021 non-null object
	Country         9786 non-null object
	Director        9652 non-null object
	Episode         1 non-null float64
	Error           154 non-null object
	Genre           9773 non-null object
	Language        9761 non-null object
	Metascore       4575 non-null float64
	Plot            9718 non-null object
	Poster          9612 non-null object
	Rated           8638 non-null object
	Released        9568 non-null object
	Response        9951 non-null bool
	Runtime         9625 non-null object
	Season          1 non-null float64
	Title           9797 non-null object
	Type            9797 non-null object
	Writer          9550 non-null object
	Year            9797 non-null object
	imdbID          9797 non-null object
	imdbRating      9662 non-null float64
	imdbVotes       9661 non-null object
	seriesID        1 non-null object
	totalSeasons    71 non-null float64
	dtypes: bool(1), float64(5), object(19)
	memory usage: 1.8+ MB
Data Removal Process:
TV Shows - I wanted to run this model on movies exclusively since tv shows may have different metrics that made them good or bad.
Errors Column - This column only had error messages for some API calls that did not go through properly.
Poster Image - Given that no features were going to be generated from the image, the image was dropped.
Only keep movies with ratings - Movies with no ratings would take a while to figure out proper values for imputing since such a different set of movies were used.
Remove Meta Score Column - Although this seemed like good metric, there were too many missing values to provide a good metric for rating movies overall.
Awards Column - This column in particular was very complex since it had oscars, awards, nominations all bundled. I decided to sum all the awards as an award value and get the sum. Any columns with null values would get 0.
Numerical Values - All columns with numerical values were converted from string format to number format.
Final Clean Data:
Data Cleaning
	RangeIndex: 8475 entries, 0 to 8474
	Data columns (total 16 columns):
	Actors           8475 non-null object
	Awards           8475 non-null int64
	Country          8475 non-null object
	Director         8475 non-null object
	Genre            8475 non-null object
	Language         8475 non-null object
	Plot             8475 non-null object
	Rated            8475 non-null object
	Runtime          8475 non-null int64
	Title            8475 non-null object
	Writer           8475 non-null object
	Year             8475 non-null int32
	imdbRating       8475 non-null float64
	imdbVotes        8475 non-null int32
	MonthReleased    8475 non-null int64
	DayReleased      8475 non-null int64
	dtypes: float64(1), int32(2), int64(4), object(9)
Visuazlizations

Median: 6.4 Rating
The movie ratings seem to all lie around this rating and left skewed towards the higher ratings.
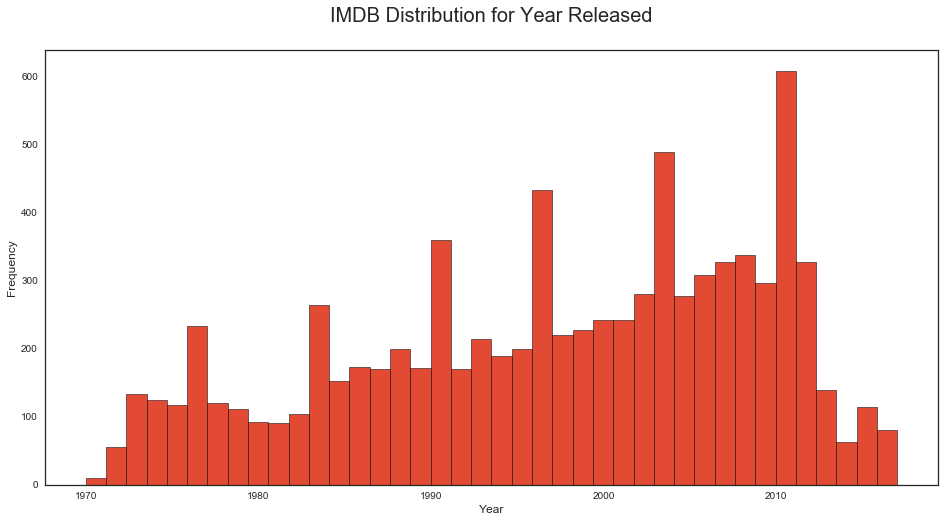
 This histogram showed movie released by year and was a shows the heavy number of movies released post 2000. This may make the models work better for movies of this time period.
Modeling and Analysis
All the columns with string values were turned into dummy variables aside from writers and plots. Writers - For one there were about 13-14 thousand writer values that would be created, the names were not very consistent so they were kept out. Given more time the data writerrs could have been cleaned up and used.
Given the distribution of the ratings falling around the median, it may be important to categorize into what is considered good and bad. Something similar to how Youtube categorizes videos (thumbs up and thumbs down). Given more time this might be three categories, good, bad, and neutral. I will utilize the median rating 6.4 as the binary indicator for high/low rating.
A binary model was picked and generated from the ratings for > or < the median.
def high_rating(rating):
    target = np.median(movies['imdbRating'])
    if rating>= target:
        return 1
    else:
        return 0
Using a random forest classifier with gradient boosting yielded the best results with an accuracy score of about 73%
| Predicted High Rating | Predicted Low Rating | |
|---|---|---|
| High Rating | 867 | 393 |
| Low Rating | 289 | 994 |
Conclusions
Overall the random forest tree did not improve significantly with gradient boost, however the score in itself was significantly good at a first shot.
The improvement was also slight but in these type of prediction models a increase in about a percent is quite significant.
I think more features could have been engineerined using the description and writers. Overall the descriptions could have yielded better results since they may describe parts of the movies that the gneres do not classify.
However adding those features might also cause overfitting, so further analysis would need to be done to get the right number of descriptors out of the description.
Further analysis would be pinning down the exact features to improve the model even more.